latest festival insights across 4 continents
We have shared insight into the sustainability actions, initiatives and highlights of festivals in 12 countries across Europe, Asia, North and South America.
Key takeaways from festivals assessed in 2025:
94% have a formal sustainable food & beverage policy
89% used reusable cups and 85% banned single-use plastic serveware
25% were fully powered by mains electricity, and battery usage continues to increase.
We reveal the festival sustainability trends from events that received the Greener Festival certification in 2025, providing insight into key impact areas such as energy & power, food & drink, waste & recycling, and travel & transport.
We assessed 24 festivals from 12 different countries including Austria, United Kingdom, Switzerland, Portugal, Spain, Estonia, the United States, India, and Colombia. The 2025 cohort also included several events taking part in our certification for the first time: the prestigious Montreux Jazz Festival, Cordillera Festival in Colombia, Estonian Fashion Festival, and one of the world’s largest EDM music festivals: Ultra Miami.
The data collected through our certification gives insights into ongoing industry-wide trends and benchmarks for the global festival sector.
The insights demonstrate some encouraging statistics, with 85% of assessed events implementing a complete ban on single-use plastics and the average recycling rate across all festivals assessed was 56%, with 5 festivals achieving a recycling rate of over 70%.
Looking at food & beverage, 94% have a formal sustainable food & beverage policy, with vegan and vegetarian dishes representing on average 53% of all food served. In addition, 17% of festivals were 100% vegetarian or vegan.
The shift to lower-carbon power supply is also notable. A quarter of festivals were run entirely on mains electricity, and there is also a growing use of zero-emission temporary power: 17% indicated having some of their power supplied by on-site renewables or battery systems. While 71% still used generators for some or all of their power, nearly half of them (47%) used 100% HVO instead of diesel.
Claire O’Neill – CEO, A Greener Future:
“Festivals are a microcosm of wider societies, and a place where we can do things better. Seeing the continued move away from fossil fuels, plastic, and industrial animal agriculture is very encouraging to see. We hope to see more festivals around the world stepping up to the mark in this summer”
Key Findings by Category:
Travel & Transport
92% monitor audience travel
The average local audience rate across all assessed festivals was 49%
29% reported a local audience rate of over 70% (from within the city or region)
On average, 63% of line ups were made up of domestic talent. A third of festivals recorded a line up consisting of over 70% domestic artists
Food & Beverage
17% of festivals are 100% vegetarian or vegan
94% have a formal sustainable food & beverage policy
89% used reusable cups
85% banned single-use plastic serverware
Vegan and vegetarian dishes represented on average 53% of all food served (by weight), while 30% of dishes served were red-meat based
Power & Fuel Use
71% used generators for some or all of their power
47% of generator-using festivals used 100% HVO instead of diesel
The average generator fuel efficiency was 2.1 kWh per litre
25% were fully powered by grid electricity
17% had over 5% of their power supplied by on-site renewables or battery systems
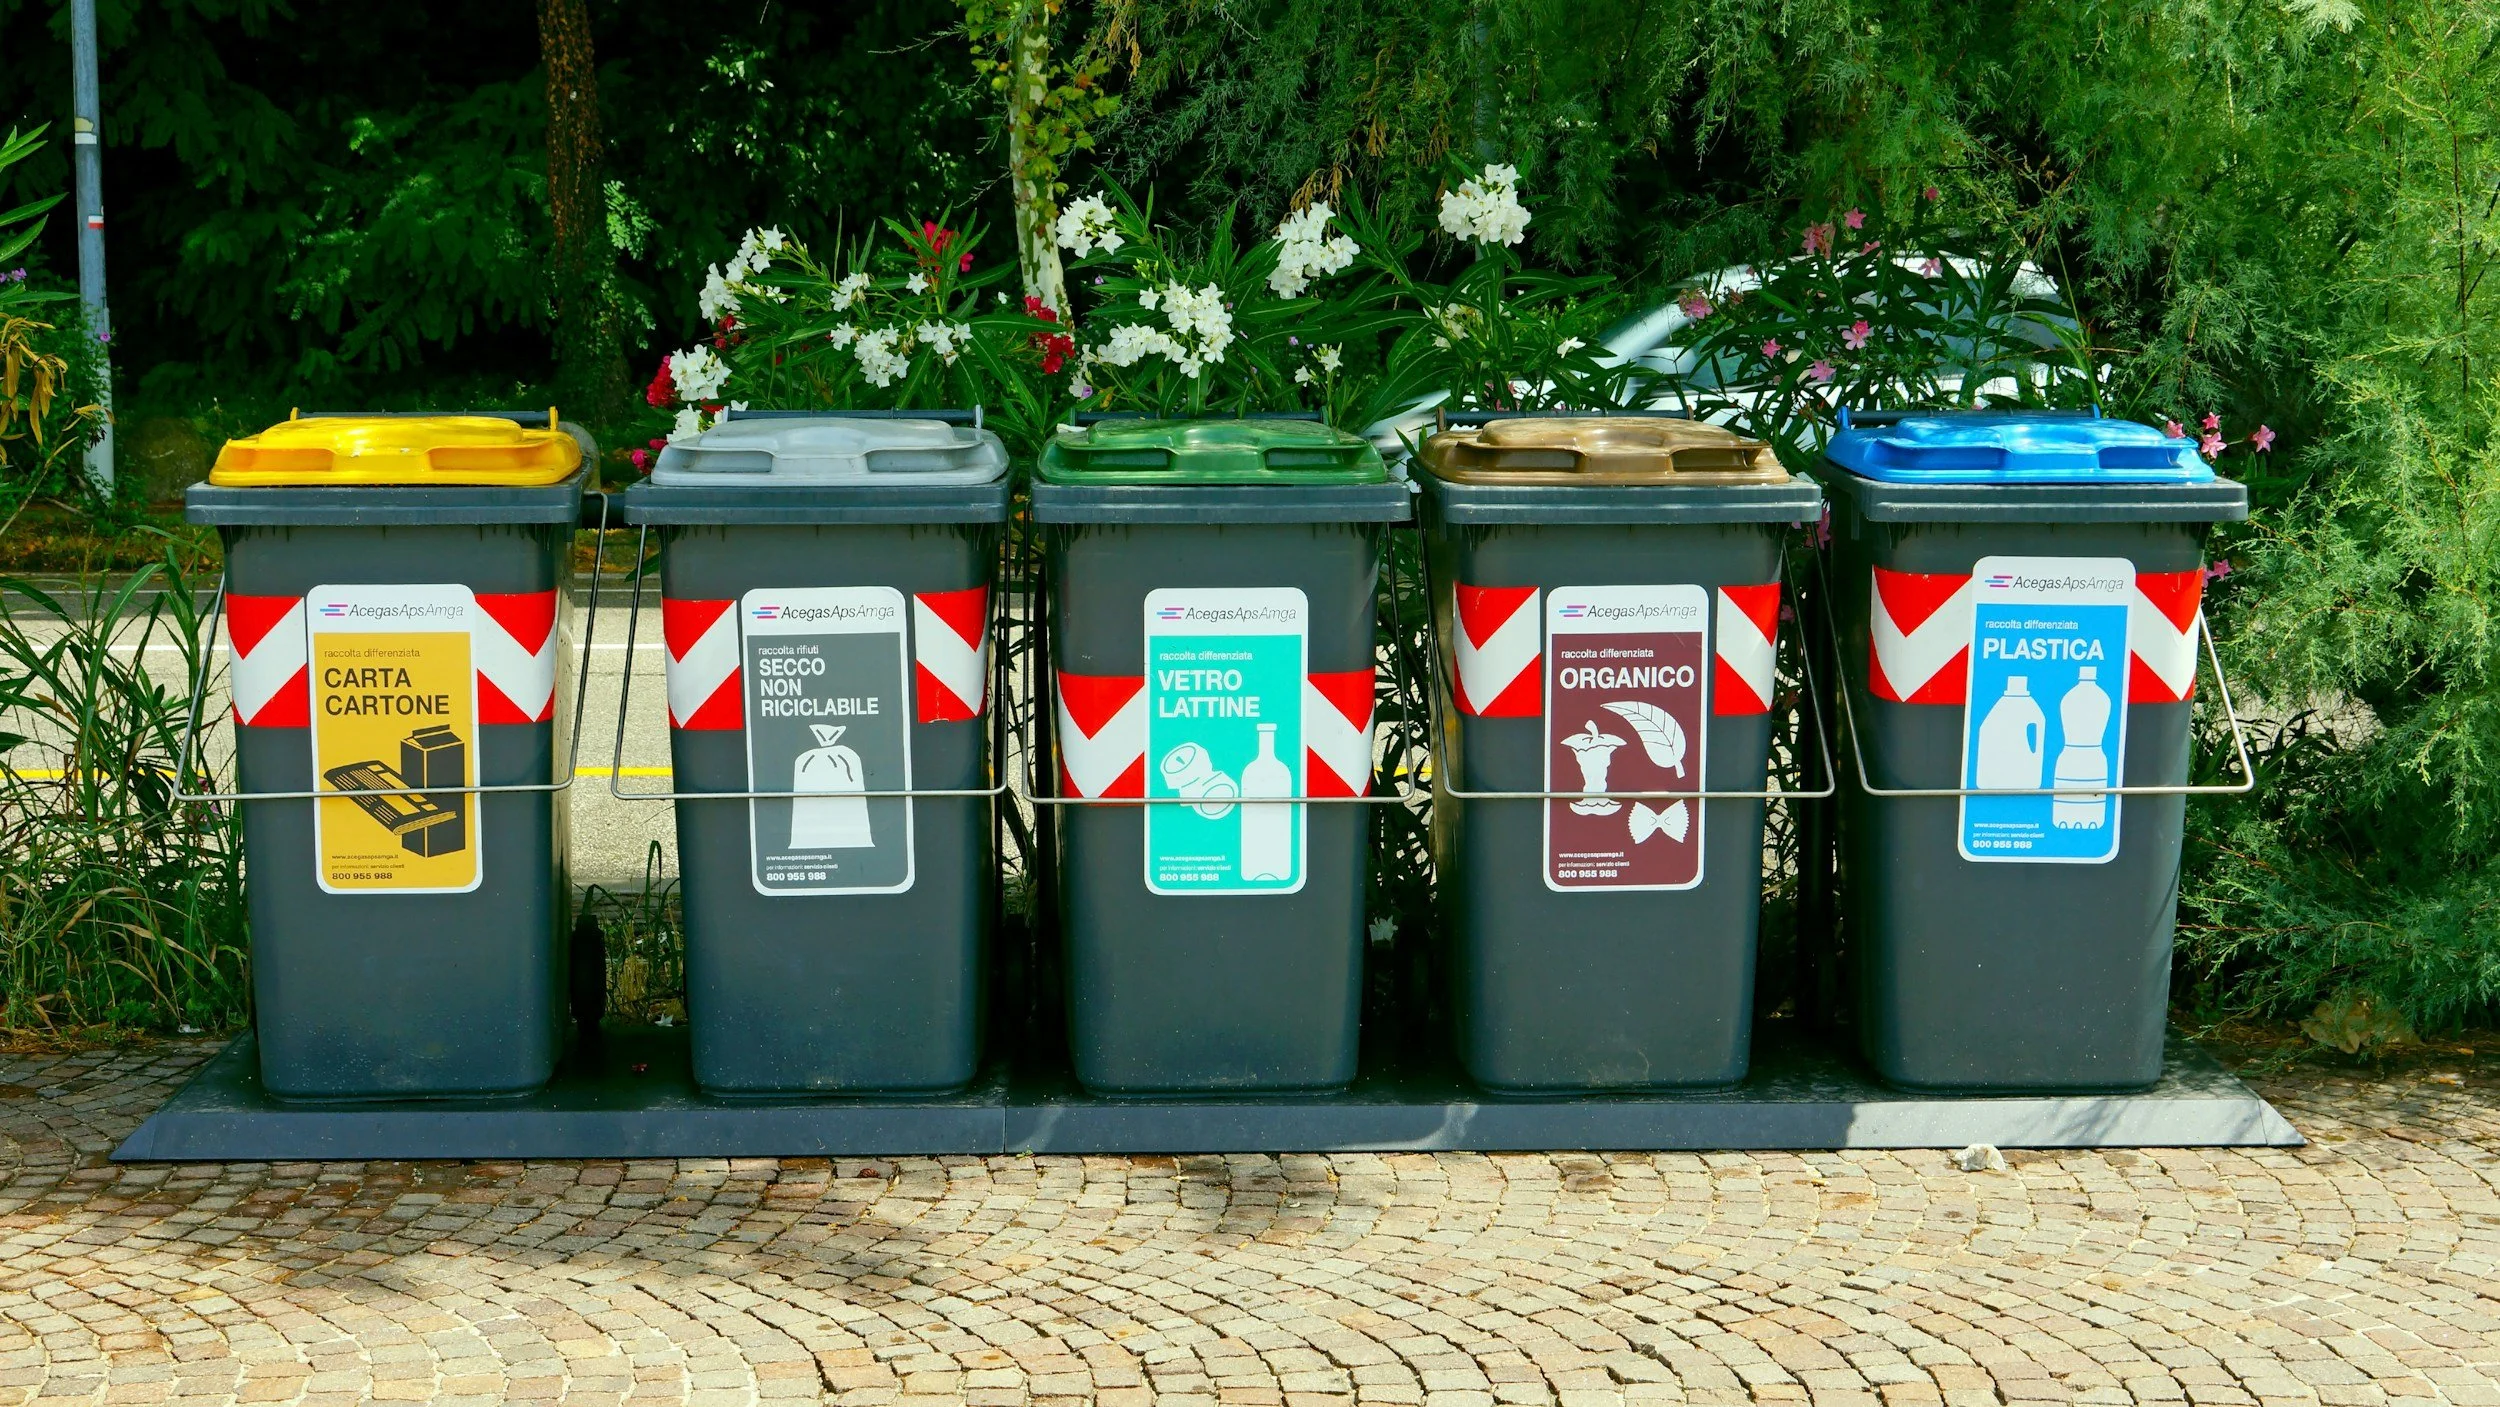
Waste & Recycling
The average site recycling rate across all festivals assessed was 56%, with 5 festivals achieving a recycling rate of over 70%
The average waste generated per person per day (pppd) was 0.76 kg
Camping festivals averaged 1.34 kg of waste pppd, while the average for non-camping festivals was nearly 2.5 times lower at 0.51 kg pppd
Water & Sanitation
The average recorded water consumption in 2025 was 10 litres pppd
Camping festivals averaged 16.3 litres of water pppd, while non-camping festivals recorded an average of 6.3 litres pppd
Wider Sustainability
87% have an Equality, Diversity and Inclusion policy
95% have an environmental and/or sustainability policy
58% invest in nature-positive environmental project or carbon removals
100% have a dedicated sustainability manager or team